These are the posts of the old forum. It was not possible to transfer the user data, so they are missing in most of the posts. For new questions, go to the general discussions.
Heterogeneous ligand model - which parameter is the correct one
- OldForum
- Topic Author
- New Member
-

Less
More
- Thank you received: 0
12 years 9 months ago #1
by OldForum
Heterogeneous ligand model - which parameter is the correct one was created by OldForum
Hi. I have been using amine coupling in my system, mostly because the system is so difficult nothing else works. However, this means I never get a decent 1:1 binding signal, and have been using the heterogeneous ligand binding model to fit my data. My question is, how do you know which KD is the right one? I assume it should be the high affinity one, but in quite a few sets of data the high affinity one is not the one with the greatest contribution to the Rmax - on the contrary, it's often only got a small contribution. Is this just because it was a particularly bad coupling day, or is something else going on? Any advice about this model and the meaning of the relative contributions to the signal would be most welcome ...
Please Log in or Create an account to join the conversation.
- OldForum
- Topic Author
- New Member
-
Less
More
- Thank you received: 0
12 years 9 months ago #2
by OldForum
Replied by OldForum on topic Heterogeneous ligand model - which parameter is the correct one
Hi Ros,
With the heterogenous model the starting values before fitting can make a difference.
Without seeing your curves and fittings I would start fitting the dissociation only.
Start fitting a 1:1 dissociation and then the heterogenous. From the dissociation and the values, judge what you expect to be the primary dissociation.
Then start the 'normal' fitting. Use the main dissociation in the first parameter and fix. Change Rmax1 to the higest measured value and the RMax2 to about 10% of Rmax1
Try fitting. What do you see? show us a figure.
If using BiaEvalution there is an option to show the relative contribution of the two intercations under View - Components.
Looking forward to your results
regards
Arnoud
Please Log in or Create an account to join the conversation.
- OldForum
- Topic Author
- New Member
-
Less
More
- Thank you received: 0
12 years 9 months ago #3
by OldForum
Replied by OldForum on topic Heterogeneous ligand model - which parameter is the correct one
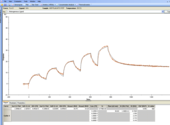
Hi Arnoud, thanks for your reply. Here's an example. I'm using a Biacore T200. I've never fitted the dissociation curves only - how do you do that? I only ever use BiaEvalution - can you do it in that?
Ros
Ros
Please Log in or Create an account to join the conversation.
- OldForum
- Topic Author
- New Member
-
Less
More
- Thank you received: 0
12 years 9 months ago #4
by OldForum
Replied by OldForum on topic Heterogeneous ligand model - which parameter is the correct one
Hmmm, that image looks way too small to see anything - will try figure out how to make it bigger.
Please Log in or Create an account to join the conversation.
- OldForum
- Topic Author
- New Member
-
Less
More
- Thank you received: 0
12 years 9 months ago - 12 years 6 months ago #5
by OldForum
Replied by OldForum on topic Heterogeneous ligand model - which parameter is the correct one
Last edit: 12 years 6 months ago by OldForum.
Please Log in or Create an account to join the conversation.
- OldForum
- Topic Author
- New Member
-
Less
More
- Thank you received: 0
12 years 9 months ago #6
by OldForum
Replied by OldForum on topic Heterogeneous ligand model - which parameter is the correct one
Hi Ros,
I looked at you sensorgram and fit.
The KD values differ a factor of 4 I think (still hard to read).
Judging on the kintics you find, I would say try again with a lower analyte concentration.
KD1 ~10-8 M-1 so start at 50 nM or 100 nM. Now you are more than 10x above the KD1.
With lower analyte concentrations the curves will fit probably better.
You can try fitting the last dissociation (of injection 5) of your sensorgram for the kd alone.
I am not familiar with the T200 software, but there must be somewhere an option.
Regards
Arnoud
Please Log in or Create an account to join the conversation.