Getting the best results.
Fitting the experimental results is not always easy. Apparently, there are deviations between the actual measured data and the model applied to the data. Visual inspection of the fitted curve will immediately show that something is wrong.
Discrepancies between data and fitting can have many origins:
- the system used is not working properly
- the experimental conditions were ill chosen
- the ligand or analyte are not what is expected
- the applied model is wrong
It is clear that only the best data will be obtained by the best system used, the best experimental conditions and the best defined interactants. This section will discuss the possible origins of and the solution to minimize disturbances in the sensorgrams.
First start with a clean machine. This part highlights the maintenance of the mechanical parts, tubing and flow chamber and introduces several cleaning protocols.
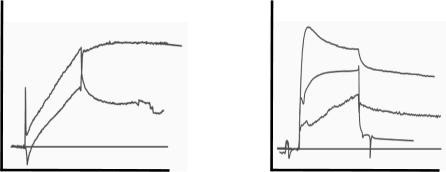
Avoiding disturbances in the sensorgrams makes the subsequent data analysis much easier. Common disturbances are shown with their solutions to avoid them.
In the artefacts section some of the more common deviations will be discussed.