SPR Instrument design
There are several configurations of SPR devices that are capable of generating and measuring surface plasmon resonance (1)
- prism coupled total reflection systems
- optical fibres
- grating coupled systems
- optical waveguide systems
Prism coupled sensors
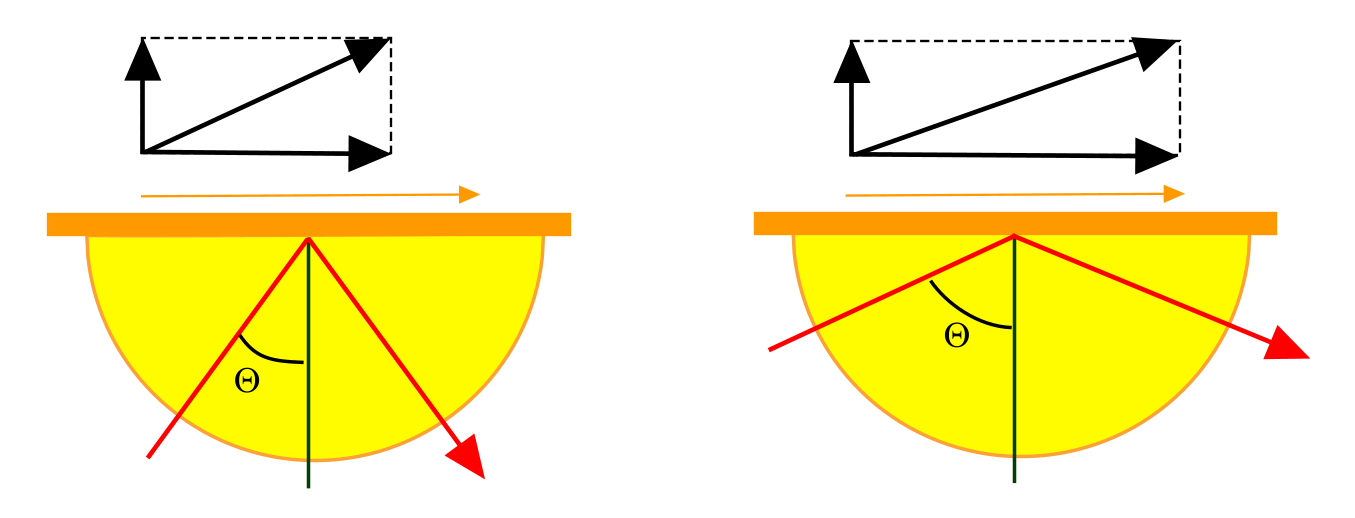
The prism-based system of SPR can be applied in different configurations. In the Otto arrangement (2),(3) there is a distance between the metal and the TIR surface (A). The space is filled with a lower refractive index medium. This configuration is useful in the study of SPR in solid phase media. However, since the distance between the metal and TIR surface reduces the SPR efficiency, it is less useful for applications with solutions (4). In the Kretschmann configuration (5), the metal layer is directly on top of the TIR surface enabling a more efficient plasmon generation (B). A third configuration looks like the Otto arrangement but uses a special layer to enhance TIR (C). The coupling of the TIR light to plasmons is done by the resonant mirror (RM) principle (6). On a prism in which the light is in TIR, a small layer of silica (~1 μm) is deposited. On top of the silica, there is a titania layer. The silica layer is thin enough to allow the evanescent field generated in the prism to couple with the titania which has a high refractive index. This so-called frustrated total internal reflection (FTIR) allows the titania layer to function as an optical waveguide. Repeated total internal reflection of the guided mode within the wave-guiding titania layer results in the production of an evanescent field at the titania-ad layer interface. The exact angle of incident light at which the resonance between the waveguide mode and the evanescently coupled light occurs is directly dependent upon the refractive index of the surface ad layer. Unlike the SPR device, however, there is virtually no loss of the reflected light intensity associated with the resonance condition. Rather, resonance is accompanied with a 2π change in phase of the reflected light, which is recorded interferometrically (6).
SPR+
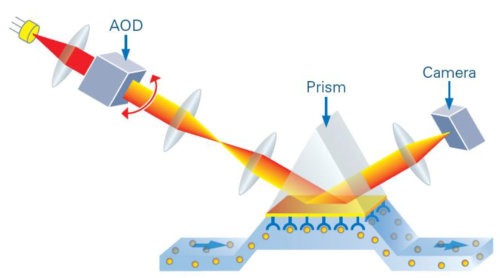
The Sierra SPR Pro series as well as the Bruker SPR #64 employs the Surface Plasmon resonance imaging detection called SPR+. SPR+ enables the imaging of 2-dimensional arrays with a level of detection sensitivity normally restricted to linear arrays. SPR+ derives its high sensitivity by combining traditional SPR imaging with high intensity laser light and high-speed optical scanning. The intensity of the light source permits the use of high-speed cameras, which in turn permit more resonance measurements per scan. The net result is lower RMS noise and improved accuracy when measuring small response changes.
Fibre optic sensors
Light will propagate through a multimode optical fibre only if it enters the fibre at certain discrete angles. Each of these angles roughly corresponds to a different mode, or route of travel. Although modes are technically more of an energy distribution in the fibre, they can be thought of as different angles of total internal reflection as the light bounces back and forth along the fibre. Low-order modes enter the fibre core at a shallow angle, and therefore bounce back and forth slowly. The energy tends to be distributed primarily in the fibre core. Higher-order modes, on the other hand, enter at a steep angle and therefore bounce back and forth very rapidly. Their energy spreads more into the cladding, and due to the evanescent wave, beyond the boundary of the waveguide itself.
How, then, is SPR sensing achieved with only a limited number of entry angles? Rather than sweeping through a range of coupling angles, as with the Kretschmann prism, the fibre allows us to sweep through a number of coupling wavelengths. These wavelengths can be processed simultaneously by using a broadband, multi-wavelength source such as white light. By measuring the intensity of each wavelength leaving the fibre, a spectrophotometer can determine which wavelength coupled with the surface plasmon and consequently how much analyte is present. The fibre optic SPR sensor is constructed using a large diameter – usually 400 nm – multimode fibre. A certain length of the fibre is completely stripped of its cladding and a surface plasmon metal such as silver is deposited in its place. This length depends on the diameter of the fibre and determines the number of reflections occurring at the surface plasmon metal interface. If the length is too short, insufficient coupling will occur. If the length is too long, coupling will be very strong and the minimum coupling intensity will be difficult to determine.
Fibre optic waveguides have a number of advantages over the bulkier prism-based sensors. Primarily, they are inexpensive and can easily be used to make disposable sensors for medical or otherwise sterile tasks. Fibres are also very small and have no moving parts, giving them a much broader range than Kretschmann sensors and make a multiple sensor array a possibility.
Grating coupled sensors
The use of grating couplers (GC) for sensors was first introduced in 1983 (7). The GC system makes use of the physics of a diffraction grating. For GC the sinusoidal grating is the optimal grating and the angle at which light couples into the waveguide depends on the biomolecules on the outside of the grating. The period (top-to-top) and amplitude (top-to-trough) of the grating will determine the wavelength of resonance. The grating replaces the need for a glass prism in traditional SPR. The grating is covered with gold. The light source illuminates the surface of the chip and the reflected light is captured by a CCD camera. By varying the incidence angle and measuring the reflected light intensity, a binding curve is created.
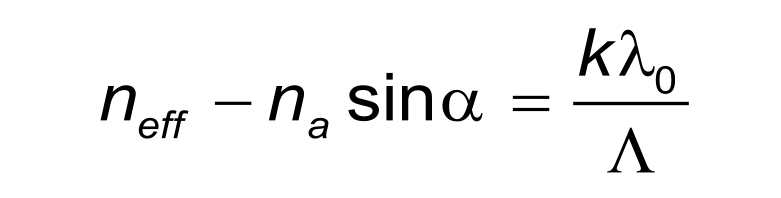
The angle of coupling of the light into a waveguide can be described by the grating formula. In this formula neff is the effective refractive index of the waveguide mode excited by the input coupling. The refractive index of the ambient, vacuum wavelength and grating constant are denoted by na, lambda (λ), and LAMBDA (Δ), respectively. The diffraction order is denoted by k. The effective refractive index, neff, of the GC will change depending on the concentration of particles within a sample.
There are two common optical configurations for GC sensors: input and output grating couplers. An input grating coupler needs a light source to be shone through the substrate onto the GC. The sample affects the coupling angle, and a detector on the end of the waveguide senses the presence of light. On the other hand, an output grating coupler uses a pre-coupled light source. When the light reaches the GC, it is uncoupled at an angle dependent on the neff. The detector, which is not attached to the GC, observes this reflection.
Optical wave-guide sensors
The optical waveguide systems have some attractive features. For example, they offer a simple way to control the optical path, and they are small and rugged. By varying the angle of incidence of the light, a light wave is guided by the waveguide. On entering the region with a grating (2400 lines/mm) and a thin metal overlay, it evanescently penetrates through the metal layer. At the end of the waveguide, the out-coming light is detected by photodiodes. An algorithm is used to model the adsorbed material linearly to surface concentrations.
Waveguide interferometer
The set-up of the waveguide makes is possible to measure both transverse electric (TE) and (TM) modes as opposed to the single TM-mode measured in the SPR instruments. While the SPR instruments can only measure the result of the interaction (density), the waveguide interferometer can measure both the density and thickness of the ad layer. The detection of the change in path length of the light through the waveguide gives a measure of the interaction at the waveguide surface. In addition, waveguide sensors are compact, robust, and easy to miniaturize, (8),(9),(10).
References
| (1) | Eugeniik Surface Plasmon Resonance - a method to analyze interfacial optical properties and to develop biosensors. (2003). |
| (2) | Otto, A. A new method for exciting non-radioactive surface plasma oscillations. Phys.Stat.Sol. 26: K99-K101; (1968). |
| (3) | Otto, A. Exitation of nonradiative surface plasma waves in silver by the method of frustrated total reflection. Z Phys 216: 398-410; (1968). |
| (4) | Nagata, K. and H. Handa Rela-Time Analysis of Biomelecular Interactions. (2000). |
| (5) | Kretschmann, E. and H. Reather Radiative decay of nonradiative surface plasmon excited by light. Z.Naturf. 23A: 2135-2136; (1968). |
| (6) | Hall, D. Use of Optical Biosensors for the Study of Mechanistically Concerted Surface Adsorption Processes. Analytical Biochemistry 288: 109-125; (2001). |
| (7) | Lukosz, W. and K. Tiefenthaler Embossing technique for fabricating integrated optical components in hard organic waveguiding materials. Opt.Lett. 8: 537-539; (1983). |
| (8) | Cross, G. H., A. A. Reeves, S. Brand, et al. A new quantitative optical biosensor for protein characterisation. Biosens.Bioelectron. 19: 383-390; (2003). |
| (9) | Wang, T. J., W. S. Lin and F. K. Liu Integrated-optic biosensor by electro-optically modulated surface plasmon resonance. Biosens.Bioelectron. 22: 1441-1446; (2007). |
| (10) | Salamon, Z., G. Tollin, I. Alves, et al. Chapter 6 Plasmon Resonance Methods in Membrane Protein Biology: Applications to GPCR Signaling. (2009). Goto reference |