Data processing
After the experiment, all the curves are in one file and have to be processed to remove stabilization, regeneration and washing steps. In general, the evaluation software provided with the instrument has functions to do this but a how and why of each step is always good to know. As an example we use the program Scrubber (1) and the interaction of the Carbonic Anhydrase II enzyme with the inhibitor Acetazolamide (2).
In Scrubber the data processing is divided in one step per tab and is completed from left to right. After loading the data in the left panel the concentrations of analyte injections are specified. The zero concentration analyte are assigned a b (buffer) but you can also fill in 0n. In this experiment a set of DMSO injections was done at the end of experiment and these entries are assigned a ´d´. The data set started with three start-up injections and one of the 10 µM injections was not valid so these entries are masked (greyed-out) and omitted from the data processing. Furthermore, there are some spikes and these are suppressed by pressing the 'spikes'-button. Now we have only the curves we want to process.
Zero in Y
The first step is to zero the curves in Y to overlay all the curves. Since we are interested in the relative responses compared to the baseline this is straight forward. Select a small timeframe just before the injection start. Avoid selecting ranges with spikes or dips.
Cropping
The curves are cropped to cut away all the unwanted parts such as the stabilization period and washing or regeneration steps. Since this example interaction has a fast dissociation, regeneration was not necessary and only the stabilization and wash step is omitted.
Zero in X (aligning)
When the instrument has flow channels that are in series, the curves can be a little out-of-phase. In addition, most fitting programs assume that the injection starts at t=0 and therefore the curves are aligned with the injection start a t=0. Align the two markers left and right off the injection start and align the curves.
Reference subtraction
Reference subtraction is done to compensate for bulk refractive index differences between flow buffer and analyte sample. In addition, some non-specific binding to the sensor chip can be compensated with reference subtraction. In the case of samples with high refractive index differences compared to the flow buffer, this step can lead to spikes at the start and end of the analyte injection. Go back to the previous step and try to align the curves better. If you run the same experiment again, a higher sample rate may help to create more data points and reduce the spikes after reference subtraction. If possible use the automatic reference subtraction during the recording of the curves. The electronic alignment of the curves is in most cases better than the curve processing afterwards.
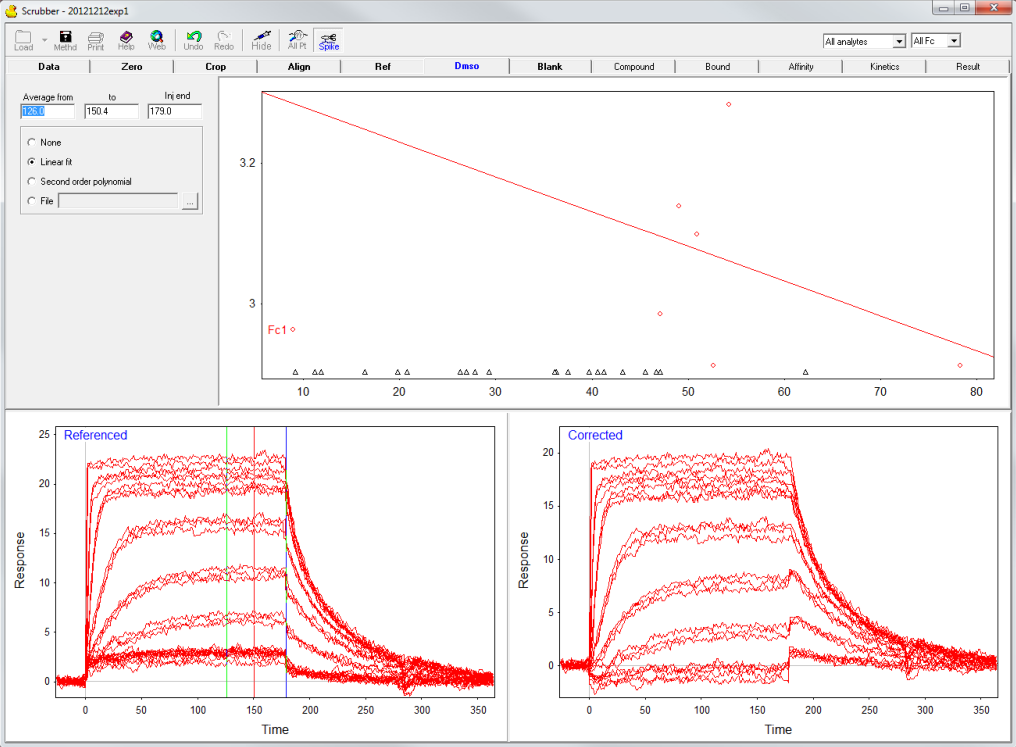
Excluded volume correction
When the analyte is dissolved in a high refractive index solution such as DMSO or glycerol the amount of immobilized ligand compared to the reference can be different which leads to differences in the recorded response. By the injection of several DMSO concentrations a calibration curve can be constructed and the differences can be corrected. In this example, the calibration curve was not properly prepared because the DMSO-range was to narrow (red circles) compared to the analyte injections (triangles). Therefore, the calibration was not used in the next steps.
Blank subtraction
The subtraction of blank injections (zero analyte concentrations) can compensate for drift and small differences between the reference and active channel. The reference subtraction and blank subtraction are often referred to as double referencing (3).
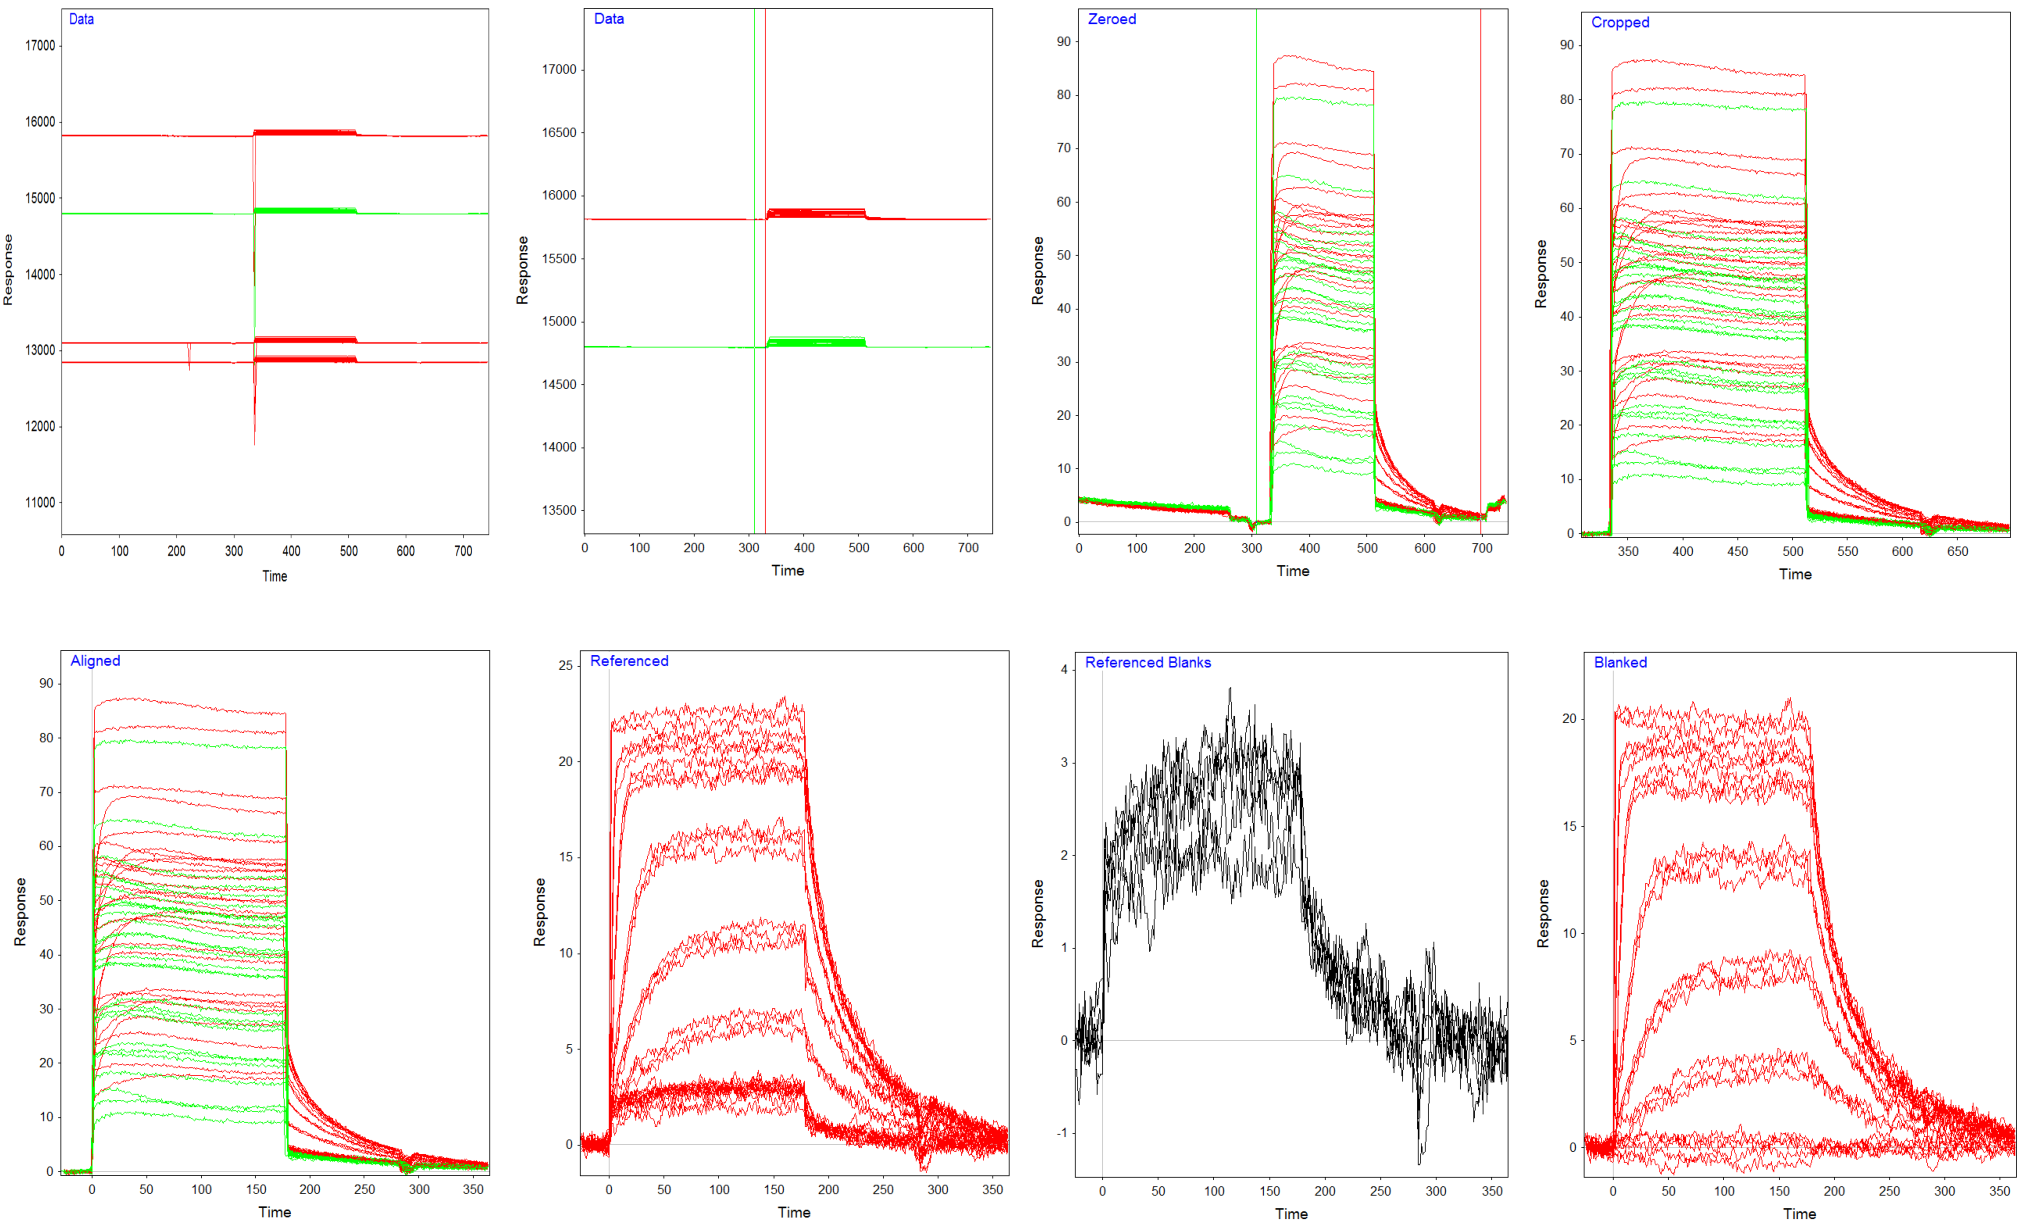
The curves are now ready for fitting. In the figure below all the steps are shown with the resulting curves.
References
| (1) | Biologic Software Scrubber. (2022). Goto reference |
| (2) | Papalia, G. A., S. Leavitt, M. A. Bynum, et al. Comparative analysis of 10 small molecules binding to carbonic anhydrase II by different investigators using Biacore technology. Analytical Biochemistry 359: 94-105; (2006). Goto reference |
| (3) | Myszka, D. G. Improving biosensor analysis. J.Mol.Recognit. 12: 279-284; (1999). Goto reference |