A sensorgram
In the previous pages you have learnt what the important parts are of the curves and sensorgrams. The following figures show a low and a high-quality sensorgram.
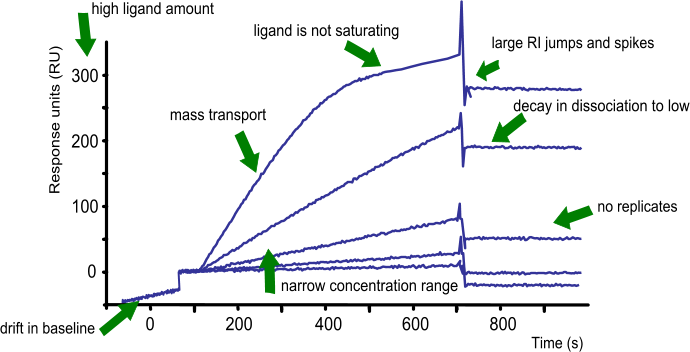
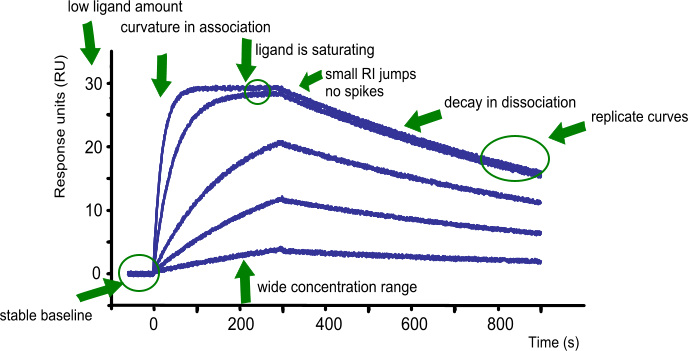
In conclusion: what to look for before fitting a set of curves?
- The baseline is flat. When the running buffer is flowing, the drift of the baseline is close to zero.
- On injection of the analyte, the buffer jump is very low.
- The association is free of mass transport.
- The curves are following the single exponential
- The curves have sufficient curvature
- There is at least one replicate
- The analyte concentration is between 0.1 – 10 times the expected KD
- The curves are well spaced in the sensorgram
- At least one of the curves is reaching steady state (when possible)
- The overall response is low
- The response is proportional to the analyte concentration and kinetics
- The dissociation is long enough for a sufficient decay in response
- The injections are randomized to avoid systematic errors
When the curves are not of high quality, optimize the experimental conditions before attempting any fitting. Fitting on bad curves will give bad answers and waste your time. Therefore, start optimizing (1).
Stes that can be taken:
- check ligand and analyte for purity and uniformity
- lower ligand density on the sensor chip
- increase flow rate to check for mass transport
- reverse ligand and analyte on the sensor chip
- change the immobilization chemistry (e.g. thiol coupling)
- Use site directed ligand coupling or capture the ligand
- add or remove salts
- add or remove detergents
References
| (1) | Rich, R. L. and Myszka, D. G. - Survey of the year 2007 commercial optical biosensor literature. J.Mol.Recognit. 21: 355-400; (2008). Goto reference |