Dissociation
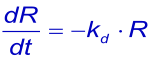
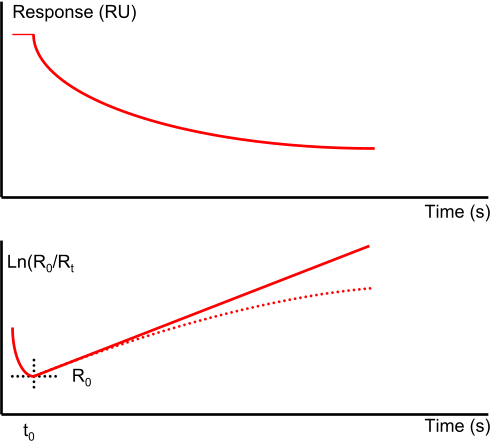
When the analyte in the flow over the surface of the chip is replaced by the flow buffer, the free concentration of the analyte suddenly drops to zero and the complex will start to dissociate. If rebinding of released analyte can be ignored, dissociation can be described by the rate equation (1):
or the linearized form
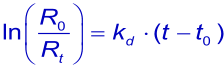
In theory, the dissociation rate constant (kd) is given by the intercept on the ordinate when the slope of the association phase of dR/dt versus R is plotted against C. In practice, however, this intercept is too close to the origin to be determined with accuracy. Dissociation rate constants can be more reliably measured from the dissociation of the analyte from the ligand after buffer replaces the analyte solution (2).
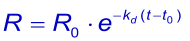
Like the association it is better / easier to fit the integrated rate equation to the experimental data:
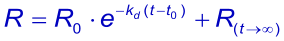
When at t → ∞ the sensorgram has not returned to zero, it is possible to take this value in the equation (3). The Evaluation software gives the value (Offset), which means the deviation from zero at t → ∞ .
The pure kinetic 1:1 dissociation in an ln(R0/Rt vs. Rt-R0 plot is a straight line while mass transport limited dissociation has a downward curvature. However heterogeneity in analyte or ligand (4),(5) or rebinding of analyte (6) can also cause this kind of plot.
Due to immobilization of the ligand and introduction of sites with different affinities, low affinity sites are only occupied when the system reaches equilibrium at Rmax. Then dissociation is not a single exponential decay and can be better described by a double exponential decay (3).
Sometimes analyte diffusion out of the matrix can give rise to non-single exponential decay. In addition, rebinding can obscure single exponential decay or lower the dissociation rate constant.
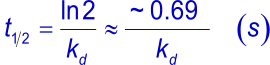
Complex half life time
The complex half-life time is the time needed to let dissociate half of the complexes to their individual components (4).
A strong binding (kd > 10-4 s-1) is difficult to analyze when the dissociation curve is to short. As a rule of thumb, the dissociation curve should decrease at least 5% before analysis is attempted. For a dissociation constant of 10-4 s-1 this will result in a dissociation time of at least 12 minutes. In addition, sufficient blank injections with the same long "dissociation" times are needed to compensate for possible baseline drift (8).
Long dissociation times are not practical when done with every injection. Instead, use the long dissociations for the highest injected analyte concentrations (8) and use for the other concentrations a short dissociation time (200—300 s). However, it is important to avoid analyte concentration that can introduce artefacts such as non-specific binding, steric hindrance or aggregation.
Below two tables to give an indication what to expect when the dissociation is strong.
| kd | R½ | R½ | R½ |
|---|---|---|---|
| (s-1) | (s) | (min) | (hour) |
| 10-1 | 7 | 0.1 | 0.0 |
| 10-2 | 69 | 1.2 | 0.0 |
| 10-3 | 693 | 11.6 | 0.2 |
| 10-4 | 6931 | 115.6 | 1.9 |
| 10-5 | 69315 | 1155.2 | 19.3 |
| 10-6 | 693147 | 11552.5 | 192.5 |
| kd | R½ | R½ | R½ |
|---|---|---|---|
| (s-1) | (s) | (min) | (hour) |
| 10-1 | 0.0 | 0.0 | 0.0 |
| 10-2 | 6 | 0.1 | 0.0 |
| 10-3 | 54 | 0.9 | 0.0 |
| 10-4 | 510 | 8.5 | 0.1 |
| 10-5 | 5130 | 85.5 | 1.4 |
| 10-6 | 51294 | 854.9 | 14.2 |
References
| (1) | Graphpad Software Graphpad Prism. (1998). |
| (2) | BIACORE AB Application note 301. Bia note (1998). |
| (3) | O'Shannessy, D. J. et al Determination of rate and equilibrium binding constants for macromolecular interactions using surface plasmon resonance: use of nonlinear least squares analysis methods. Analytical Biochemistry 212: 457-468; (1993). |
| (4) | BIACORE AB BIACORE Technology Handbook. (1998). |
| (5) | Morton, T. A. et al Interpreting complex binding kinetics from optical biosensors: a comparison of analysis by linearization, the integrated rate equation, and numerical integration. Analytical Biochemistry 227: 176-185; (1995). |
| (6) | van der Merwe, P. A. et al Affinity and kinetic analysis of the interaction of the cell adhesion molecules rat CD2 and CD48. EMBO J. 12: 4945-4954; (1993). |
| (7) | BIACORE AB Kinetic and affinity analysis using BIA - Level 1. (1997). |
| (8) | Katsamba, P. S. et al Kinetic analysis of a high-affinity antibody/antigen interaction performed by multiple Biacore users. Analytical Biochemistry 352: 208-221; (2006). |