These are the posts of the old forum. It was not possible to transfer the user data, so they are missing in most of the posts. For new questions, go to the general discussions.
ka calculation problem
- OldForum
- Topic Author
- New Member
-

Less
More
- Thank you received: 0
12 years 11 months ago - 12 years 6 months ago #1
by OldForum
ka calculation problem was created by OldForum
Hallo.
I am working with the BIAlite system and determining protein-protein interactions.
There are some problems in the calculated ka values using BIAevolution software 3.
To show my problem there are two pictures.
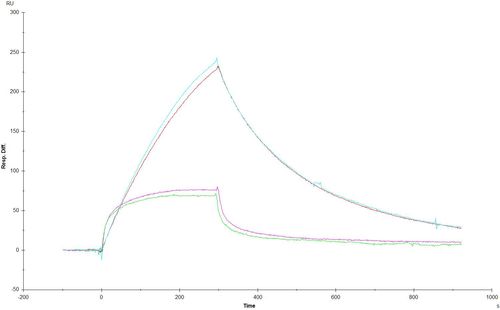
In the first one you see the interaction curves of a wild type protein (upper ones) and a point mutation (lower ones). Tthe calculated ka values are around 50 1/Ms for the upper curves (WT protein) and 3000 1/Ms for the lower curves (Mutant). Because of this low ka value the calculated KD of the wild type protein is much higher than the KD for the mutant. That’s strange in my opinion. For me the curves looks like a much stronger interaction for the wild type protein.
image
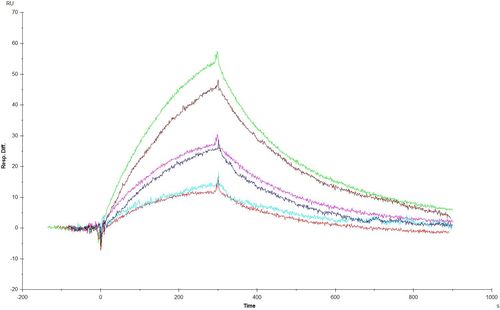
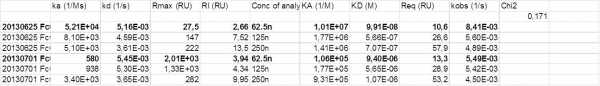
In the second picture you see a repeated measurement. The two lowest curves (lowest concentrations) are looking very similar to me. The BIAevolution software calculated in the separate fitting for one of them a ka of 50 000 and for the other on a ka of 500. That’s very strange. I don’t see such a big difference in the two curves.
Do you have any idea why the ka values are so different?? What should I change to get “better” more logical data?
Thanks for any replies and ideas
Armin
I am working with the BIAlite system and determining protein-protein interactions.
There are some problems in the calculated ka values using BIAevolution software 3.
To show my problem there are two pictures.
In the first one you see the interaction curves of a wild type protein (upper ones) and a point mutation (lower ones). Tthe calculated ka values are around 50 1/Ms for the upper curves (WT protein) and 3000 1/Ms for the lower curves (Mutant). Because of this low ka value the calculated KD of the wild type protein is much higher than the KD for the mutant. That’s strange in my opinion. For me the curves looks like a much stronger interaction for the wild type protein.
image
In the second picture you see a repeated measurement. The two lowest curves (lowest concentrations) are looking very similar to me. The BIAevolution software calculated in the separate fitting for one of them a ka of 50 000 and for the other on a ka of 500. That’s very strange. I don’t see such a big difference in the two curves.
Do you have any idea why the ka values are so different?? What should I change to get “better” more logical data?
Thanks for any replies and ideas
Armin
Last edit: 12 years 6 months ago by OldForum.
Please Log in or Create an account to join the conversation.
- OldForum
- Topic Author
- New Member
-
Less
More
- Thank you received: 0
12 years 11 months ago #2
by OldForum
Replied by OldForum on topic ka calculation problem
Hi Armin,
For the second figure, try first to fit the dissociation alone. Use the kd value as a fixed value to fit the ka. The try to fit ka and kd simultanously putting the values you obtained as starting values. Don't forget to give the Rmax values to.
If the curves are repeats you should analyze them globally.
Can you show an overlay of the fitting?
Can you give the analyte concentrations, ka, kd and Rmax for the first figure?
You can try to make a simulation and change some values to look what is going on.
Arnoud
Please Log in or Create an account to join the conversation.
- OldForum
- Topic Author
- New Member
-
Less
More
- Thank you received: 0
12 years 11 months ago - 12 years 6 months ago #3
by OldForum
Replied by OldForum on topic ka calculation problem
Hallo Arnoud
Thanks for the reply.
For the second picture i did it as you said. First I fit the dissociation alone; then used the calculated values of kd to fit the ka values. The result was that the values for kd differentiate between 500 and 50 000 1/Ms.
The curves are repeats, but that didn't explain the big difference. In my opinion the two curves look almost identically.That’s the results of the separate fitting
I will check the fitting curves and will upload them later. I will also try a simulation. That's a good idea
Armin
Last edit: 12 years 6 months ago by OldForum.
Please Log in or Create an account to join the conversation.
- OldForum
- Topic Author
- New Member
-
Less
More
- Thank you received: 0
12 years 11 months ago #4
by OldForum
Replied by OldForum on topic ka calculation problem
Hi Armin,
I see your problem. The fitting algoritm does go wrong all the way. This sometimes happens when it get locked with the wrong values.
Since your injections are duplo's over the same surface you must fit the Rmax globally! This probably will solve your problem.
Next step is to fit the kd and Rmax globally and then ka, kd and Rmax.
In addition, you can change the ka starting values with a factor 10 or 100. Say 1.0 E5 or 1.0 E6. It is always a good idea to fit the curves with different initial values in case the algoritm gets locked up.
Arnoud
Please Log in or Create an account to join the conversation.