These are the posts of the old forum. It was not possible to transfer the user data, so they are missing in most of the posts. For new questions, go to the general discussions.
Negative curves but not inverted
- OldForum
- Topic Author
- New Member
-

Less
More
- Thank you received: 0
13 years 3 months ago #1
by OldForum
Negative curves but not inverted was created by OldForum
Hi,
I am testing two different library of DNA-aptamers for their ability to bind a small molecule on the SPR-chip surface. The two libraries have obviously different sequences in it. The reference library should bind only "non-specifically if at all" the small molecule (reference cell), while the second library should bind the small molecule with more affinity. The idea is to use the signal subtraction Fc2-1 to "see" only the specific binding. In order to do this I use a bare gold chip, functionalise it with the thiolated libraries at the same concentration (between 1uM and 0.1uM), passivate with 6-mercapto-hexanol (1mM) and then place the chip on a Biacore X200. The actual program has for each cycle injection of 180s, dissociation of 240s, and regeneration with NaCl 1M - SDS 0.2%. The first three cycles are for conditioning-zeroing, then I inject my small molecule at the concentrations of 0.02uM-0.2uM-2uM-20uM-200uM-20uM and then another zero concentration cycle. All the solutions are based on TE buffer 1x. Now, the first time I tried this (with 0.25uM ss-thio-DNA from the libraries incubated onto the surface) I got a good Fc2-1 plot (zeroed-cropped-aligned-referenced in Scrubber2):
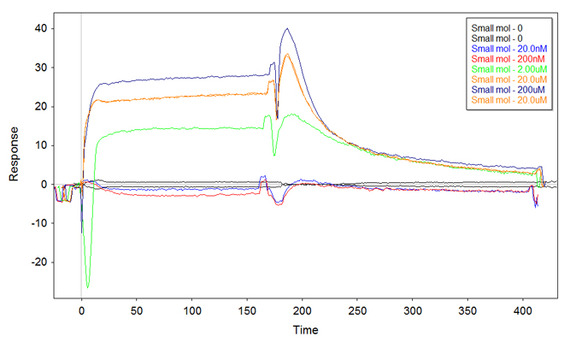
Although the curve at 2uM starts negative, I clearly see the binding. I repeated the same experiment straight away to confirm (same ss-thio-DNA), and got similar results. However, when I tried to repeat the experiment with newly made ss-thio-DNA (same surface concentration) I got the following sensorgram:
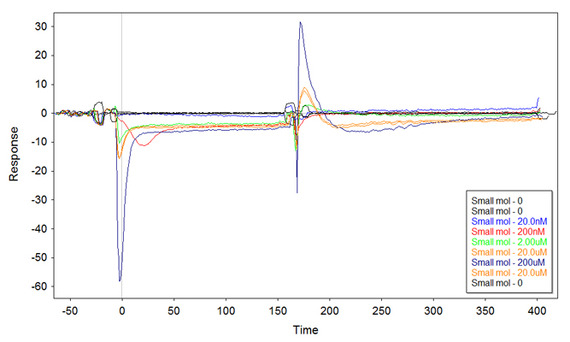
And here I'm puzzled. What is this? I got something similar several times, so I can exclude random errors or problems with the second DNA.
I thought that putting more DNA on the surface might improve the plot, but this is the result with 1uM ss-thio-DNA incubated onto the surface:
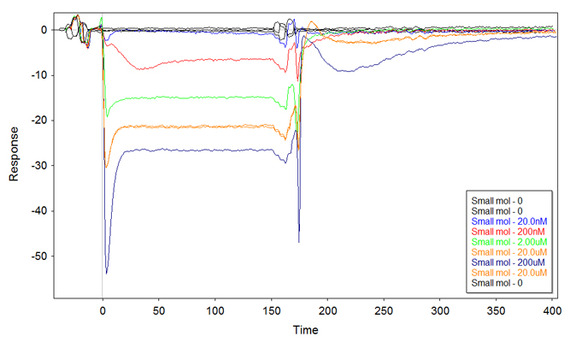
Even more puzzled now. At a very quick sight, it might seem that the small molecule binds more Fc1 than Fc2, and that would explain the negative values. However, if this would be the case then the kinetic does not fit. I would indeed expect to have a kinetic reversed (on the "x" axis) with respect to the first plot. Instead, the curves go negative but then they increase with a kinetic similar to the first plot.
The question is: what is this due to? Is it an effect of the badly referenced bulk effect? Or if somehow the reference cell Fc1 would respond to the bulk effect more than the Fc2, this would explain these curves. However, how do I correct this and based on which theoretical basis?
Thanks a lot for the help!
fabio
I am testing two different library of DNA-aptamers for their ability to bind a small molecule on the SPR-chip surface. The two libraries have obviously different sequences in it. The reference library should bind only "non-specifically if at all" the small molecule (reference cell), while the second library should bind the small molecule with more affinity. The idea is to use the signal subtraction Fc2-1 to "see" only the specific binding. In order to do this I use a bare gold chip, functionalise it with the thiolated libraries at the same concentration (between 1uM and 0.1uM), passivate with 6-mercapto-hexanol (1mM) and then place the chip on a Biacore X200. The actual program has for each cycle injection of 180s, dissociation of 240s, and regeneration with NaCl 1M - SDS 0.2%. The first three cycles are for conditioning-zeroing, then I inject my small molecule at the concentrations of 0.02uM-0.2uM-2uM-20uM-200uM-20uM and then another zero concentration cycle. All the solutions are based on TE buffer 1x. Now, the first time I tried this (with 0.25uM ss-thio-DNA from the libraries incubated onto the surface) I got a good Fc2-1 plot (zeroed-cropped-aligned-referenced in Scrubber2):
Although the curve at 2uM starts negative, I clearly see the binding. I repeated the same experiment straight away to confirm (same ss-thio-DNA), and got similar results. However, when I tried to repeat the experiment with newly made ss-thio-DNA (same surface concentration) I got the following sensorgram:
And here I'm puzzled. What is this? I got something similar several times, so I can exclude random errors or problems with the second DNA.
I thought that putting more DNA on the surface might improve the plot, but this is the result with 1uM ss-thio-DNA incubated onto the surface:
Even more puzzled now. At a very quick sight, it might seem that the small molecule binds more Fc1 than Fc2, and that would explain the negative values. However, if this would be the case then the kinetic does not fit. I would indeed expect to have a kinetic reversed (on the "x" axis) with respect to the first plot. Instead, the curves go negative but then they increase with a kinetic similar to the first plot.
The question is: what is this due to? Is it an effect of the badly referenced bulk effect? Or if somehow the reference cell Fc1 would respond to the bulk effect more than the Fc2, this would explain these curves. However, how do I correct this and based on which theoretical basis?
Thanks a lot for the help!
fabio
Please Log in or Create an account to join the conversation.
- OldForum
- Topic Author
- New Member
-
Less
More
- Thank you received: 0
13 years 3 months ago #2
by OldForum
Replied by OldForum on topic Negative curves but not inverted
Hi,
Lets start with the last figure. You say:
Instead, the curves go negative but then they increase with a kinetic similar to the first plot.
I see that the highest analyte concentration has the lowest response after reference subtraction. Ergo, I suspect that your reference is binding more than your specific channel.
Check your raw data before reference subtraction. If you use a passivated surface, is the problem still there?
The interesting thing is that your 20 uM duplo seems to be ok.
Concerning the dips at the begin and end of the curves. Do you use the best injection type (Kinject)? In Scrubber you should be able to get rid of most of the dips. Did you try to match the buffers?
I can imagin that a 200 uM solution has a lot of bulk effect. Sometimes the algoritems have difficulty with resolving steep parts of the curves.
Arnoud
Please Log in or Create an account to join the conversation.
- OldForum
- Topic Author
- New Member
-
Less
More
- Thank you received: 0
13 years 3 months ago #3
by OldForum
Replied by OldForum on topic Negative curves but not inverted
Hi, thanks for the quick reply!
Here my answers to your points:
It is true that my highest concentration gives the lowest response, and that the responses are "proportional" to the concentration (old dogma for biologist that indicates cause-effect relationship). Nevertheless, in my maybe naive view, a "regular" binding kinetic has a curve like more or less the first plot I posted when Fc2 binds and Fc1 don't (or less). So a crescent that tends to a plateau. Now, if I would invert the two flow cells functionalisations I should get the mirrored plot over the X axis, shouldn't I? So it should be a negative-crescent that tends to a negative plateau. This obviously out of injection-delay effects. But this is not the case in my third plot, where the curve is a sharp negative peak, followed by a (relative) crescent that reaches a plateau. This is what I do not understand. On this point I am planning in the next days an experiment where I do invert the functionalisations, to see what happens. Also, I will perform the same experiment with the reference ss-thio-DNA in both Flow Cells, in order to see how does it look like when the two Fc do (or don't) bind exactly the same.
I do always check my row data before reference subtraction, they do look fine. I also tried to get out kinetic parameters for each channel in all the three experiments, and then try to "normalize" them over the respective reference cell. But still it does not give real answers.
I forgot to mention in the post that all my experiments are with passivated surface (6-Mercapto-Hexanol, 30min after functionalisation), and this is done always in the same way.
Buffers are always the same. Running buffer is TE1x, all the solutions are made in final TE1x, including the Small molecule serial dilutions (the first, so the 200uM, is coming from a 1mM stock in TE1x). The Small molecule has surely a decent bulk effect, well visible when looking at the singe Fc signals. That's the reason why I perform the experiment with reference subtraction. In a former experiment, where Fc1 was only passivated with 6-Mercapto-Hexanol, the same injections gave maximum signal of 175RU for 200uM, 20RU for 20uM and 5RU for 2uM. Although this is a combination of unspecific binding + bulk effect, it is the best estimation I have for the bulk effect. Would you consider this a "big" bulk effect?
I am not really aware of the injection type you are mentioning (Kinject). What I do is using the Biacore X100 "kinetic" wizard, and adjusting the injection time, the dissociation time and the flow speed (5ul/min for the whole experiment). I did not know you can choose the "type" of injection. Anyway, this would not explain why sometimes the plots are in the positive area and some other in the negative area I think.
Last point, the spike remover of Scrubber does a neat job in polishing the peaks. However, the negative spikes at the beginning of the injections are still there, and this do not influence the overall kinetic analysis, as the Ka, Kd, KD and Rmax will remain the same. If I could artificially not consider the negative steep part of each curve, thus start each curve from the steep crescent and set this to 0, this would have an impact on the kinetic analysis. But would this be theoretically justified? I could not figure this out...
I will keep posting the results of my further tests, hoping that this will help to understand what's going on..
Please Log in or Create an account to join the conversation.
- OldForum
- Topic Author
- New Member
-
Less
More
- Thank you received: 0
13 years 3 months ago #4
by OldForum
Replied by OldForum on topic Negative curves but not inverted
Hi,
I have some comments:
Regarding the injections, I don't have access to a X100 so I don't know exactly how the software works. But if you use the kinetic program I think you have the best option. I would raise the flow rate to at least 40 ul/min to shorten the injection delay between the flow cells. This can solve the negative spike.
The bulk effect you have is OK (a little high for 200 uM but what can you do?). As said before, sometimes the software has difficulties with resolving steep curves and will give a negative spike.
It looks like that the fuctionalization of the gold surface is not constant or reproducable. Maybe the reagents are detoriating over time? I have to say I don't have experience with this type of setup.
I did play around with the first and last sensorgram. If you take the steady state responses (t= 120 second) of the first sensorgram and plot them against the concentration you will find a nice curve with KD ~2.5 uM.
If you take the last sensorgram and invert the values, you get KD ~1.3 uM. Not bad. It sounds a bit strange to invert it but it gives an idea that the interaction is still there but that somehow the referencing is messed up.
I think is is hard to omit the negative steep part of the curves and still try to fit them. Every time you omit a part of the curve you have to explain why you did it and prove that it is not affecting the results. It is better to find the cause and solve the problem.
Arnoud
Please Log in or Create an account to join the conversation.
- OldForum
- Topic Author
- New Member
-
Less
More
- Thank you received: 0
13 years 3 months ago #5
by OldForum
Replied by OldForum on topic Negative curves but not inverted
Hi,
I might have found an answer to my problem. I repeated the experiment with the highest concentration of ss-thio-DNA on the surface (putting 1uM for the functionalization) as before, but this time I denaturated the ssDNA before functionalization (i.e. boil the samples for 5min, and cool them quickly on ice). The result I got is the following:
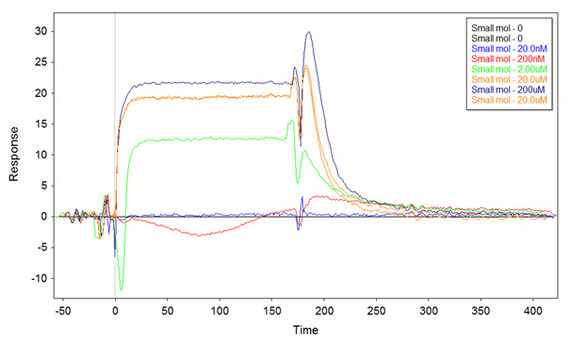
There are still some negative peaks, but the overall binding is positive and very similar to what I obtained the first time.
Why denaturing the ss-thio-DNA prior to functionalization should help? That’s not so obvious to me, but I came up with an explanation. The ssDNA can hybridize to itself, but also to the other molecules in solution, thus forming complex structures. I think they might get quite big, forming kind of DNA “balls”. These structures will allow only few thiol groups to be close to the surface, and therefore to be able to covalently bind to the gold. Having big DNA structures on the surface might affect the quick (30’) passivation step with 6-mercapto-hexanol, for instance by preventing its binding in some areas. Once the chip gets into the Biacore, I normally first perform some conditioning cycles, which include also a regeneration step with high salt and a detergent. This might finally remove the non-covalently bound ssDNA from the surface, thereby leaving some spots of bare gold. Bare gold is a sticky surface, and it can unspecifically bind the Small molecule, therefore interfering with the experiment.
One obvious question is whether there is any evidence for that. Well, I might have found one, by looking at the first two conditioning cycles and comparing the two Flow cells (without adjustment or zeroing) of the two experiment (without and with denaturation, left and right respectively):
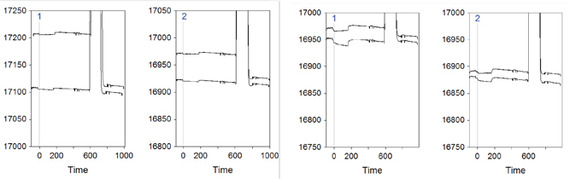
Flow cell1 is denoted by the blue 1 on the top left of the sensorgram, while Flow cell2 is marked as 2. The uppermost curve is the first cycle in all the sensorgrams, while the lower one is cycle number 2. The peak that goes out of scale is the regeneration injection, which is followed by a stabilization period (= new baseline).
In the most-left sensorgram it is possible to see a sharp decrease of the baseline after the regeneration if the first conditioning cycle. This drop is bigger than what happens in Flow cell2 of the same experiment (2nd plot from the left), and much bigger than Flow cell1 and Flow cell2 of the denaturing experiment (plots 3 and 4 from the left). This might indicate that indeed in the experiment without ssDNA denaturation there is something leaving the surface after regeneration, and that thus there might be more covered gold surface.
This raises the second question: why Flow cell1 has this effect more than Flow cell2 in the experiment without denaturation? My speculation on this is that the library in Flow cell1 is much more complex than the one in Flow cell2, therefore it allows more cross-hybridization.
The last question arising from this speculative hypothesis is whether some more spots of bare gold on Flow cell1 surface can really mask the specific binding in Flow cell2. To my knowledge, the unspecific binding is generally quick on- quick off, therefore it might increase the signal quicker than the specific binding in Flow cell2. As for the negative differential signal, I can only speculate that if the bare gold areas are big enough they can actually bind more than the specific ss-thio-DNA on Flow cell2.
I hope this might help somebody running in the same problems, and I will be happy to share opinion or alternative explanations for this phenomenon.
Bye,
Fabio.
I might have found an answer to my problem. I repeated the experiment with the highest concentration of ss-thio-DNA on the surface (putting 1uM for the functionalization) as before, but this time I denaturated the ssDNA before functionalization (i.e. boil the samples for 5min, and cool them quickly on ice). The result I got is the following:
There are still some negative peaks, but the overall binding is positive and very similar to what I obtained the first time.
Why denaturing the ss-thio-DNA prior to functionalization should help? That’s not so obvious to me, but I came up with an explanation. The ssDNA can hybridize to itself, but also to the other molecules in solution, thus forming complex structures. I think they might get quite big, forming kind of DNA “balls”. These structures will allow only few thiol groups to be close to the surface, and therefore to be able to covalently bind to the gold. Having big DNA structures on the surface might affect the quick (30’) passivation step with 6-mercapto-hexanol, for instance by preventing its binding in some areas. Once the chip gets into the Biacore, I normally first perform some conditioning cycles, which include also a regeneration step with high salt and a detergent. This might finally remove the non-covalently bound ssDNA from the surface, thereby leaving some spots of bare gold. Bare gold is a sticky surface, and it can unspecifically bind the Small molecule, therefore interfering with the experiment.
One obvious question is whether there is any evidence for that. Well, I might have found one, by looking at the first two conditioning cycles and comparing the two Flow cells (without adjustment or zeroing) of the two experiment (without and with denaturation, left and right respectively):
Flow cell1 is denoted by the blue 1 on the top left of the sensorgram, while Flow cell2 is marked as 2. The uppermost curve is the first cycle in all the sensorgrams, while the lower one is cycle number 2. The peak that goes out of scale is the regeneration injection, which is followed by a stabilization period (= new baseline).
In the most-left sensorgram it is possible to see a sharp decrease of the baseline after the regeneration if the first conditioning cycle. This drop is bigger than what happens in Flow cell2 of the same experiment (2nd plot from the left), and much bigger than Flow cell1 and Flow cell2 of the denaturing experiment (plots 3 and 4 from the left). This might indicate that indeed in the experiment without ssDNA denaturation there is something leaving the surface after regeneration, and that thus there might be more covered gold surface.
This raises the second question: why Flow cell1 has this effect more than Flow cell2 in the experiment without denaturation? My speculation on this is that the library in Flow cell1 is much more complex than the one in Flow cell2, therefore it allows more cross-hybridization.
The last question arising from this speculative hypothesis is whether some more spots of bare gold on Flow cell1 surface can really mask the specific binding in Flow cell2. To my knowledge, the unspecific binding is generally quick on- quick off, therefore it might increase the signal quicker than the specific binding in Flow cell2. As for the negative differential signal, I can only speculate that if the bare gold areas are big enough they can actually bind more than the specific ss-thio-DNA on Flow cell2.
I hope this might help somebody running in the same problems, and I will be happy to share opinion or alternative explanations for this phenomenon.
Bye,
Fabio.
Please Log in or Create an account to join the conversation.