These are the posts of the old forum. It was not possible to transfer the user data, so they are missing in most of the posts. For new questions, go to the general discussions.
Protein G
- OldForum
- Topic Author
- New Member
-

Less
More
- Thank you received: 0
13 years 7 months ago #1
by OldForum
Protein G was created by OldForum
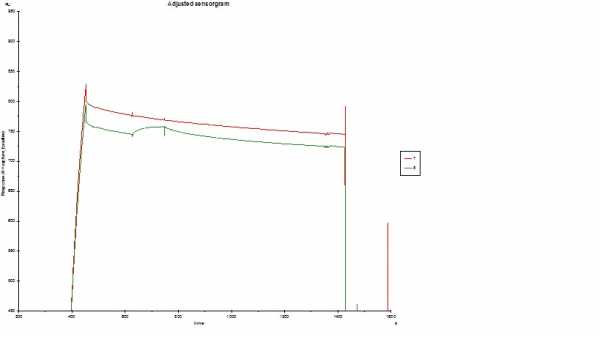
Hello. This is the first time I am trying Protein G. I immobilized Protein G on a CM5 surface. Got about ~2500 immobilization level. Then flowed a rabbit Ab (conc. 20ug/mL) then my protein (11.5 kDa). I got a little bit of binding but got horrible drift. Any suggestions? Actually, I tried an Ab mouse also. Got an antibody response but no ag response (data not shown). I would like to use Protein G to capture other species (ie. mouse, sheep, goat, etc.) so I don't have to make a separate chip for each species. Is there anything I need to know about Protein G? Should I use Protein A? Protein A/G? Protein L? Any advice would be most helpful. But for now, the drift is my biggest problem. See sensorgram below. Thanks.
mtarca
mtarca
Please Log in or Create an account to join the conversation.
- OldForum
- Topic Author
- New Member
-
Less
More
- Thank you received: 0
13 years 7 months ago #2
by OldForum
Replied by OldForum on topic Protein G
Hi mtarca
Calculate the theoretical response of your protein:
Response of protein to captured IgG: Rmax = (800 * 11500) / 150000 = 61 RU
This is the theoretical Rmax when saturating the captured antibody (per antibody 1 molecule bound). Luckily, you don’t need to saturate the ligand to get meaningful results. When I look at your sensorgram, the binding looks ok (reasonable response and curvature with this analyte concentration). In addition the reference channel 1 is decaying at the same rate so you can subtract this to isolate the interaction.
I have two publications for you which can help you further.
1. Bergstr+Âm, Gunnar and Mandenius, Carl Fredrik; Orientation and capturing of antibody affinity ligands: Applications to surface plasmon resonance biochips. Sensors and Actuators B: Chemical (158): 265-270; 2011.
2. Joss, L. et al; Interpreting kinetic rate constants from optical biosensor data recorded on a decaying surface. Anal.Biochem. (261): 203-210; 1998.
In addition you can browse www.piercenet.com/browse.cfm?fldID=01010316 (Protein G Resins and Kits) for more information.
Also look at Tech Tip #34 which gives an overview of the Protein G binding characteristics for different IgG species.
Please Log in or Create an account to join the conversation.