These are the posts of the old forum. It was not possible to transfer the user data, so they are missing in most of the posts. For new questions, go to the general discussions.
Inverted curve
- OldForum
- Topic Author
- New Member
-

Less
More
- Thank you received: 0
13 years 11 months ago #1
by OldForum
Inverted curve was created by OldForum
Hi SPR users,
I am working with coagulation proteins and i am using Biacore T100 for my measuring the kinetics and affinities of protein-protein interactions.
Running buffer : 25 mM Hepes +150mM Nacl+5 mM Cacl2 with .005% P20 at pH 7.4
Regeneration buffer : 25 mM Hepes +1000mM Nacl with .005% P20 at pH 7.4
Concetration of protein used for binding study = 50nm and 200nM (analyte with Mol.Wt=330,000 kDa)
ligand immobilized = 2000RUs with mol.Wt = 30kDa
Question:
As i set up the experiments i am getting the inverted curve (i.e. below the baseline). as i increase the concentration of the analyte the curve goes deeper and deeper below thw baseline. what does it mean? to me it is first experience to see the curves like these?
do anybody experienced it before? plz let me know how to rectify this.
Sathyan
Please Log in or Create an account to join the conversation.
- OldForum
- Topic Author
- New Member
-
Less
More
- Thank you received: 0
13 years 11 months ago #2
by OldForum
Replied by OldForum on topic Inverted curve
Hi Sathyan,
First is made this a separate topic
To check what is going on, try injecting buffer first to see if the baseline is stable.
Then inject buffer followed with your regeneration two or three times. Does it look OK --> flat baseline, baseline at start buffer injection is the same etc.
Then inject your sample. Check the buffer of your sample: is it low or high salt? , glycerol, DMSO etc?
You observed a lower dip with higher analyte concentration so I suspect an analyte buffer mismatch. How deep is the dip. Can you post a sensorgram?
regards
Arnoud
Please Log in or Create an account to join the conversation.
- OldForum
- Topic Author
- New Member
-
Less
More
- Thank you received: 0
13 years 11 months ago #3
by OldForum
Replied by OldForum on topic comment on Inverted curve + figures
Hello fellow SPR-users,
I seem to have the same problem when working with the T200 and SA-chips from Biacore.
Coated ligand is Biotin-aptamers (25kD), coupled to the Streptavidin on the SA-chips. My analyte is a protein (CRP), where these aptamers were selected for, which is 115kD in size and a pI from 5.3
Running buffer and sample buffer is the same: 10mM Hepes + 5mM CaCl2 at pH 7.4.
Immobilisation of DNA works fine and can nicely be controlled by manipulation of association conditions. In flowcell 2 (or 4) selected aptamers are coupled, in flowcell 1 (or 3) a dummy-oligonucleotide of the same size as a blank.
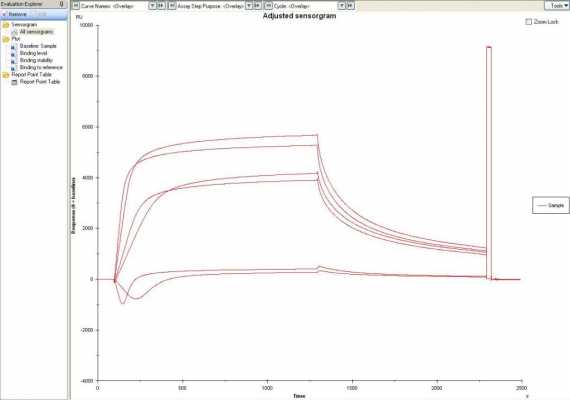
When injecting a high analyte concentration, the blank substracted (2-1; 4-3) sensorgrams show an inverted curve, while looking at the flow cells seperately, it is clear that CRP binds on both flow cells, even stronger and faster on flow cell 1 (explaining the dip of about 1500 RU), while flow cell 2 'catches up' (explaining the rise in the blank substracted after some time).
fig 1 shows this effect for 2 concentrations (50mM and 100mM CRP);
When changing the DNA on flow cell 1 into another oligo of greater, smaller or same size it doesn't make any difference in the sensorgram. When adding no DNA, it is clear that CRP interacts quite strongly with the empty chip surface as well (with the dextran matrix or the SA). When adding salts to the buffer, this effect is decreased significantly, so we need to take aspecific binding of CRP to the matrix and salt concentrations into account.
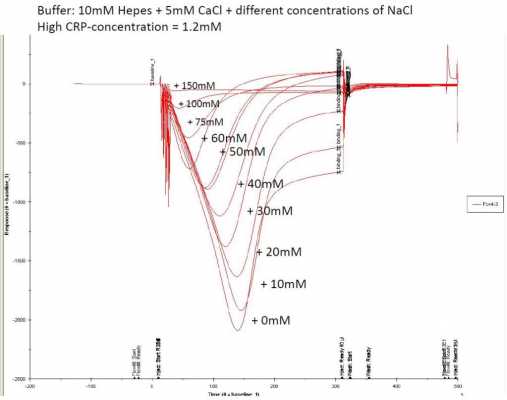
When injecting the same concentration of CRP in Hepes buffer with different salt concentrations, we can have the 'dip' moving to the left and not as deep. This means aspecific binding on the blank flow cell decreases, while respons on flow cell 2 becomes higher faster. Off course, when working with aptamers, you should respect the binding range of the aptamer, since this also depends on salt concentration. As can be seen on the figure, increasing NaCl concentration in the buffer gives a positive respons faster, until an upper limit is reached for the aptamer for binding of the target. When not working with aptamers, you can add NaCl untill the dip disappears completely (i guess).
In my case, adding 50-60 mM NaCl gives the best positive respons after association.
fig.2 shows the effect of increasing NaCl (going from 0 mM to 150mM, which is the flat respons curve)
When injecting different concentrations of CRP (for binding analysis or kinetics) in the 10mM Hepes + 50mM NaCl + 5mM CaCl buffer, it is clear that the dip goes deeper and is sharper for higher concentrations. In the dissociation phase, the signal response increases in a concentration-dependent way, indicating that the CRP stays longer on fc 2 than fc 1, because of binding with the aptamer.
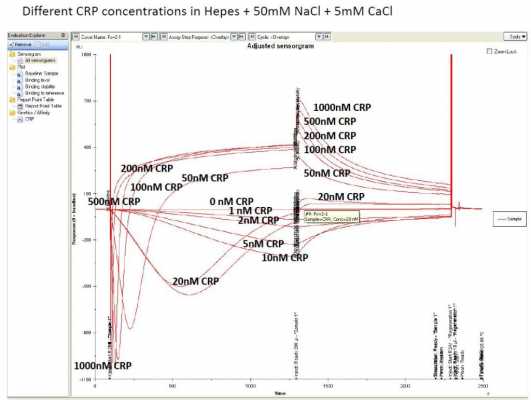
With this curves, it is possible to determine affinity (KD) but no kinetics (kd and ka), because fitting of the strange curves seems impossible.
Any more experience on this? Any tips to get rid of this dip while keeping the aptamers functional?
Arnoud, what do you mean with this analyte buffer mismatch you are talking about?
kind regards
Jeroen V
Biomed
University of Hasselt
I seem to have the same problem when working with the T200 and SA-chips from Biacore.
Coated ligand is Biotin-aptamers (25kD), coupled to the Streptavidin on the SA-chips. My analyte is a protein (CRP), where these aptamers were selected for, which is 115kD in size and a pI from 5.3
Running buffer and sample buffer is the same: 10mM Hepes + 5mM CaCl2 at pH 7.4.
Immobilisation of DNA works fine and can nicely be controlled by manipulation of association conditions. In flowcell 2 (or 4) selected aptamers are coupled, in flowcell 1 (or 3) a dummy-oligonucleotide of the same size as a blank.
When injecting a high analyte concentration, the blank substracted (2-1; 4-3) sensorgrams show an inverted curve, while looking at the flow cells seperately, it is clear that CRP binds on both flow cells, even stronger and faster on flow cell 1 (explaining the dip of about 1500 RU), while flow cell 2 'catches up' (explaining the rise in the blank substracted after some time).
fig 1 shows this effect for 2 concentrations (50mM and 100mM CRP);
When changing the DNA on flow cell 1 into another oligo of greater, smaller or same size it doesn't make any difference in the sensorgram. When adding no DNA, it is clear that CRP interacts quite strongly with the empty chip surface as well (with the dextran matrix or the SA). When adding salts to the buffer, this effect is decreased significantly, so we need to take aspecific binding of CRP to the matrix and salt concentrations into account.
When injecting the same concentration of CRP in Hepes buffer with different salt concentrations, we can have the 'dip' moving to the left and not as deep. This means aspecific binding on the blank flow cell decreases, while respons on flow cell 2 becomes higher faster. Off course, when working with aptamers, you should respect the binding range of the aptamer, since this also depends on salt concentration. As can be seen on the figure, increasing NaCl concentration in the buffer gives a positive respons faster, until an upper limit is reached for the aptamer for binding of the target. When not working with aptamers, you can add NaCl untill the dip disappears completely (i guess).
In my case, adding 50-60 mM NaCl gives the best positive respons after association.
fig.2 shows the effect of increasing NaCl (going from 0 mM to 150mM, which is the flat respons curve)
When injecting different concentrations of CRP (for binding analysis or kinetics) in the 10mM Hepes + 50mM NaCl + 5mM CaCl buffer, it is clear that the dip goes deeper and is sharper for higher concentrations. In the dissociation phase, the signal response increases in a concentration-dependent way, indicating that the CRP stays longer on fc 2 than fc 1, because of binding with the aptamer.
With this curves, it is possible to determine affinity (KD) but no kinetics (kd and ka), because fitting of the strange curves seems impossible.
Any more experience on this? Any tips to get rid of this dip while keeping the aptamers functional?
Arnoud, what do you mean with this analyte buffer mismatch you are talking about?
kind regards
Jeroen V
Biomed
University of Hasselt
Please Log in or Create an account to join the conversation.
- OldForum
- Topic Author
- New Member
-
Less
More
- Thank you received: 0
13 years 11 months ago #4
by OldForum
Replied by OldForum on topic comment on Inverted curve + figures
Hi Jeroen,
To answer your last question first: The flow buffer of the system and the buffer of your analyte should be the same. This will prevent buffer jumps at the beginning and end of the analyte injections.
I don't think the problem is with the machines.
First thing I see is that your response units are way to high!!!!!!!
If you persue kinetics you should have low responses. I suggest you start (re)reading the SPRpages.
From the curves in the first figure I can say that your are looking at mass transport and not kinetics.
Do you really need 50 - 100 mM CRP? This is a very high (non fysiological) concentration.
You say that CRP binds to the sensorchip surface. Then try to change analyte and ligand. This can solve your problem.
In addition you can try to use a different type of sensorchip, like one without dextran or use a modified hydrofobic surface like the L1 of Biacore.
I disagree that you can determine affinities with these curves. You should first have normal curves and understand your interaction system better.
I you want more information please contact me via the Contact - contribute section.
Kind regards
Arnoud
Please Log in or Create an account to join the conversation.