Is the equilibrium dissociation constant all what matters?
In kinetics there seems to be a race for the best (lowest in this context) equilibrium dissociation constant (KD) there is. Interactions are compared by their equilibrium dissociation constant and that is it. Similarly often only the IC50 of a system is given while the full kinetics are not well established (1).
In my opinion, reporting a single value for a kinetic interaction is hiding all the other information present in the measurements between two or more components.
Using kinetic interaction methods such as surface plasmon resonance and bilayer interferometry, the results contain more information than the equilibrium dissociation constant alone. In addition, these techniques make it possible to change the assay conditions (e.g. buffer composition, pH or temperature) to determine what their influence is on the kinetic constants.
Look at the affinity plot and follow the line of the KD = 10-9 M. The little sensorgrams show that kinetics that differs greatly in association and dissociation rate constant can lead to the same KD. It follows that even when for instance antibodies have the same equilibrium dissociation constant, they can differ in kinetics. Depending on the application, this difference can be important.
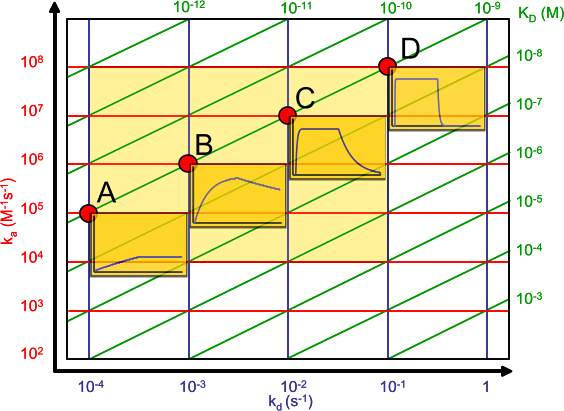
For instance, when developing an ELISA you seek antibodies, which dissociate very slowly, therefore washing will not affect the signal. However, the association rate can be relative slow because you can extent the incubation time to reach equilibrium. On the other hand, when developing antibodies for purification you seek fast binders because in a column the contact times can be short. The dissociation should be relatively slow, but easily to manipulate for elution of the protein of interest (2).
What is the KD?
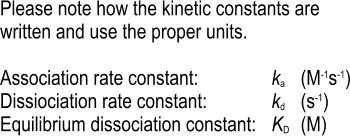
The equilibrium dissociation constant is the quotient of de dissociation rate constant (kd) and the association rate constant (ka).
Both rate constants describe the speed of the association and dissociation (during a 1:1 interaction) and give therefore additional information on the interaction kinetics compared to the equilibrium dissociation constant. The equilibrium dissociation constant has a clear meaning: it is the concentration (in Molar) of analyte where 50% of the ligand is occupied by the analyte in a 1 to 1 interaction.
Although the rate constants ka and kd are specific for a specific ligand-analyte pair, they are independent of the concentration of both ligand and analyte. However, the rate constants are dependent on the buffer composition, pH, and temperature of the solution (3). In most cases a different interaction environment gives a slightly different answer. For instance, some experiments are done at 20°C, 25°C or 37°C and this will give a kinetic difference (4) but can also be used in thermodynamic characterisation of the interaction. In addition, SPR relies on the immobilization of the ligand to the sensor surface. The act of immobilization can alter (a part of) the ligand molecules on the sensor surface introducing non-ideal kinetics.
Therefore, it is important to keep the experimental conditions constant and to describe these in publications. Nevertheless, when experimental conditions are closely monitored the kinetic results between different experiments are comparable (5),(6),(7),(8).
More information from kinetics
The interaction dynamics involves the orientation, collision rate and the force of the participating molecules. The nature of the interaction between two components is steered by Ionic, hydrogen, hydrophobic and van der Waals interactions.
Parameters that can be used to investigate the kinetics are the chemical environment (composition and pH), solution viscosity and the temperature. Although, most factors are correlated with each other (e.g. viscosity is dependent on the temperature) and therefore cannot be investigated separately, some aspects can give more information on the type and behaviour of the interaction.
By changing the ionic strength and pH of the environment the charge of the molecules is varied and electrostatic interaction can be modulated. By performing kinetic experiments at different temperatures the thermodynamic properties (enthalpy and entropy) of the interaction system can be calculated (9).
Comparing kinetics.
From above it may be clear that a change in environment during a kinetic measurement will change the kinetic constants. So before comparing kinetic parameters (KD but also ka and kd) you must be sure that the conditions of the measurement is the same (7),(8).
In biological experiments a certain bias is expected. For instance the variation in the outcome of an ELISA can be up to 10%. This is due to variation in the standard curve and samples that are measured. A inter- and intra-assay variation of below 10% is considered a good assay. The same applies to SPR measurements. The buffer, ligand and analyte purity will be the main drivers of the variation. In addition, the analyte concentration measurements have a direct influence on the measured association rate constant.
What is considered different between kinetic parameters is not absolute determined. As can be seen from the global benchmark by Rebecca Rich et al. (8) the kinetic parameters can be very close between SPR instruments, laboratories and users. In another study with 22 participants (6) it was found that the variability of the association and dissociation constants was less than 14%.
So it is possible to get the same answer for the same interactant pair provided that the experimental conditions are the same.
That leaves the question:
when are the differences too big to talk about the same interaction?
To be honest, I don't know. We hardly compare our measurements with those of others. If we compare for instance antibodies, we make ranges of say sub nanomolar binders, nanomolar binders, 20 – 100 nM binders and above. An affinity plot is very helpful with ranking because the association and dissociation rates in the graph makes it immediately clear how the equilibrium dissociation constant is calculated.
What is your goal?
I end with a question to you.
How important is it to have the exact kinetic constants of an interaction pair under the exact experimental conditions?
References
| (1) | Papalia, G. A., A. M. Giannetti, N. Arora, et al. Thermodynamic characterization of pyrazole and azaindole derivatives binding to p38 mitogen-activated protein kinase using Biacore T100 technology and van't Hoff analysis. Analytical Biochemistry 383: 255-264; (2008). Goto reference |
| (2) | Sibler, A. P., M. Baltzinger, L. Choulier, et al. SPR identification of mild elution conditions for affinity purification of E6 oncoprotein, using a multivariate experimental design. Journal of Molecular Recognition 21: 46-54; (2008). Goto reference |
| (3) | Andersson, K., L. Choulier, M. D. Hamalainen, et al. Predicting the kinetics of peptide-antibody interactions using a multivariate experimental design of sequence and chemical space. J.Mol.Recognit. 14: 62-71; (2001). Goto reference |
| (4) | Navratilova, I., G. A. Papalia, R. L. Rich, et al. Thermodynamic benchmark study using Biacore technology. Analytical Biochemistry 364: 67-77; (2007). Goto reference |
| (5) | Cannon, M. J., G. A. Papalia, I. Navratilova, et al. Comparative analyses of a small molecule/enzyme interaction by multiple users of Biacore technology. Analytical Biochemistry 330: 98-113; (2004). Goto reference |
| (6) | Katsamba, P. S., I. Navratilova, M. Calderon-Cacia, et al. Kinetic analysis of a high-affinity antibody/antigen interaction performed by multiple Biacore users. Analytical Biochemistry 352: 208-221; (2006). Goto reference |
| (7) | Navratilova, I., G. A. Papalia, R. L. Rich, et al. Thermodynamic benchmark study using Biacore technology. Analytical Biochemistry 364: 67-77; (2007). Goto reference |
| (8) | Rich, R. L., G. A. Papalia, P. J. Flynn, et al. A global benchmark study using affinity-based biosensors. Analytical Biochemistry 386: 194-216; (2008). Goto reference |
| (9) | Zeder-Lutz, G., E. Zuber, J. Witz, et al. Thermodynamic analysis of antigen-antibody binding using biosensor measurements at different temperatures. Analytical Biochemistry 246: 123-132; (1997). Goto reference |